Visualizing with Blender
The basics
There are two functions in the library to visualize objects in Blender. convert() is intended to work for almost all objects you can create with the library like spheres, quadrics and subspaces. vertices() provides additional options to visualize points.
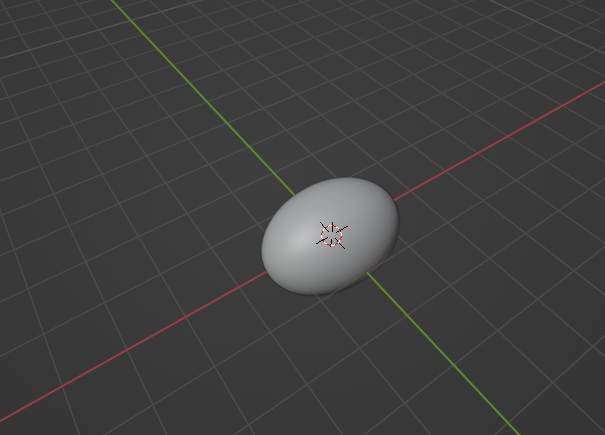
As an example we create a quadric (ellipsoid).
>>> import numpy as np
>>> import ddg
>>> ellipsoid = ddg.geometry.Quadric(np.diag([1 / 2, 1, 1, -1]))
>>> bobj = ddg.blender.convert(ellipsoid, "Ellipsoid")
You should get something looking like this:
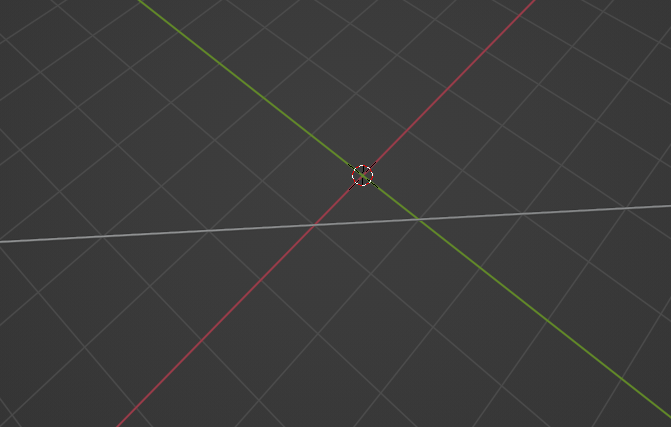
You can also visualize subspaces:
>>> line = ddg.geometry.subspace_from_affine_points([1, 0, 0], [0, 1, 0])
>>> bobj = ddg.blender.convert(line, "Line")
The API documentation for convert() contains an exhaustive list of examples.
Names
You always need to set a name for the object to visualize. This name must be unique, otherwise you will get errors.
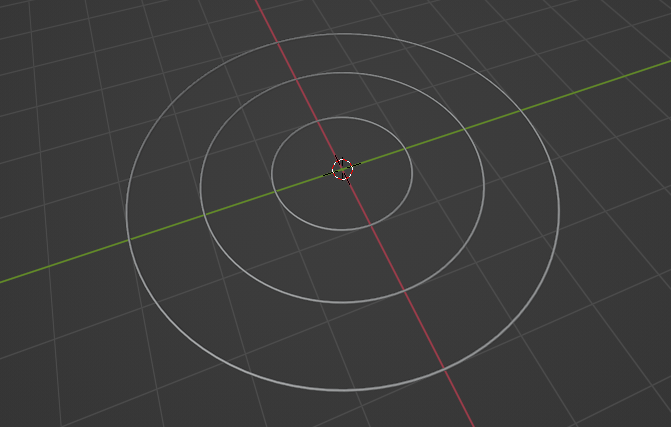
If you need to create multiple objects in a loop, use enumerate to add an index. Here we create multiple circles in the form of a conics with different radii.
>>> euc_2 = ddg.geometry.euclidean(2)
>>> list_of_circles = [euc_2.sphere((0, 0, 1), r) for r in range(1, 4)]
>>> for i, circle in enumerate(list_of_circles):
...     bobj = ddg.blender.convert(circle, f"circle {i}")
...
Blender objects, curves and meshes
convert() always returns a Blender object or more precisely, a bpy.types.Object.
It has attributes that you can change after it was created.
For example
>>> bobj.hide_viewport = True
will make the line vanish from the viewport and it will reappear after
>>> bobj.hide_viewport = False
Every Blender object has a data attribute.
Most of the time, this is a Blender curve of type bpy.types.Curve for 1-dimensional objects, or a Blender mesh of type bpy.types.Mesh for 2-dimensional objects.
They also have interesting attributes.
For example, for a curve you can change its bevel_depth which is its thickness.
>>> bobj.data.bevel_depth = 0.1
For more information, refer to Blender’s documentation:
Scattering points and edges
You can use convert() to visualize points or 0-dimensional subspaces, but it is recommended to use vertices(), where you can change how the points are to be visualized.
>>> point = ddg.arrays.Points([0, 1, 1])
>>> bobj = ddg.blender.vertices(point, "Point", radius=0.1)
See the documentation for more details vertices().
The function scatter() allows to put arbitrary meshes at each vertex position.
Similarly, if you wish to only visualize the edges of a mesh, use edges().
Visualizing SmoothNet and SmoothCurve
By design convert() cannot visualize ddg.nets.SmoothNet and ddg.nets.SmoothCurve.
The sampling section of the nets documentation describes how to obtain a ddg.nets.DiscreteNet or ddg.nets.DiscreteCurve from a smooth net or curve.
These can be visualized directly with convert().
Customizing visualization
By design convert() provides reasonable defaults to convert every pyddg object except for ddg.nets.SmoothNet and ddg.geometry.SmoothCurve.
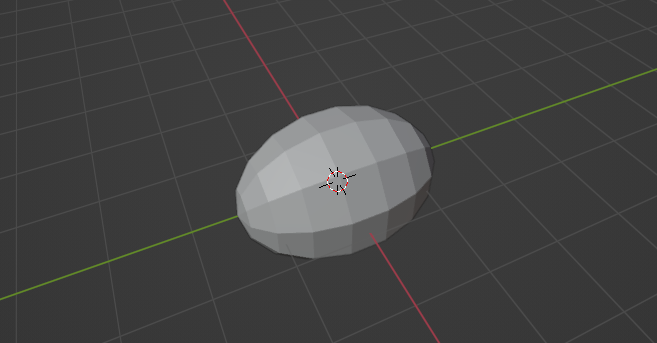
For example, it samples smooth objects such as quadrics with reasonably high quality and embeds pyddg objects in R^2 into the xy-plane of R^3.
>>> ellipsoid = ddg.geometry.Quadric(np.diag([1 / 2, 1, 1, -1]))
>>> sampled_ellipsoid = ddg.arrays.from_quadric(ellipsoid, (10, 0.1), (10, 0.1))
>>> bobj = ddg.blender.convert(sampled_ellipsoid, "Sampled Ellipsoid")
The module ddg.arrays contains similar functions every pyddg object other than ddg.nets.SmoothNet an ddg.nets.SmoothCurve, e.g.
from_quadric()for manual samplingfrom_quadric_sphere()for manual samplingfrom_indexed_face_set()to choose a coordinate attribute other thancofrom_half_edge_surface()to choose a coordinate attribute other thancofrom_1d_subspace()to create long line segments from addg.geometry.Subspacefrom_2d_subspace()to create large rectangles from addg.geometry.Subspaceline_segment_from_points()to create a line segmentline_segment_from_point_and_direction()to create a line segment